


.svg)


.svg)


Context
Market makers are essential in maintaining smooth market operations. By continuously quoting bid and ask prices, they provide liquidity that allows traders to execute orders efficiently, even for large or complex trades.
In the SPX, with around 20,000 contracts available at any time, market makers enable traders to tailor their strategies and access liquidity that might not otherwise be possible. By taking the opposite side of these trades, however, market makers sometimes hold residual positions. These positions carry inherent risks, as option values can fluctuate significantly due to factors like changes in the underlying asset’s price.
Since the introduction of daily 0DTE (zero days to expiration) options in spring 2022, along with a surge in overall options trading volume—particularly in shorter-term contracts—market makers have encountered increased structural challenges. The short-term nature of these options leads to pronounced fluctuations to their pricing, demanding increased hedging efforts. These intensified responses can have a considerable impact on the underlying price, further shaping market dynamics. To manage directional risk, market makers employ a strategy called delta hedging, which helps offset potential changes in their portfolio’s value tied to underlying price movements.
Delta hedging is designed to maintain a balanced delta exposure by trading the underlying asset, effectively stabilizing the portfolio’s value despite shifts in the underlying price. By continuously adjusting their hedges, market makers can minimize the direct impact of spot price movements on their options portfolio, helping to achieve a neutral directional risk.
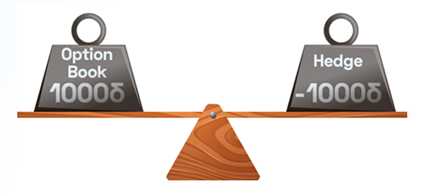
Figure 1. Delta Hedging Illustrated
To understand delta more clearly, let’s explore a simple example. Suppose you purchase a call option on a stock, where each contract represents 100 shares. The call option has a delta of 0.5, meaning that for every dollar increase in the stock price, the option’s value rises by 50 cents per share, leading to a $50 gain (given the 100-share quantity). Conversely, a $1 drop in the stock price would decrease the option’s value by $50.
To balance this exposure, delta hedging involves creating an offsetting position. For a call option with a delta of 0.5, you would hedge by shorting 50 shares of the underlying stock. For a put option with a delta of -0.5, delta hedging would require purchasing 50 shares. This offsetting approach aims to stabilize the portfolio by neutralizing the directional risk tied to the stock’s price.
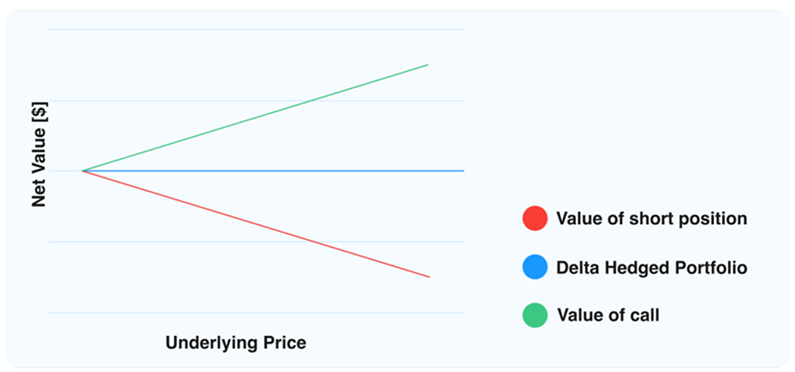
Figure 2. Call Option Delta Hedging
Delta, however, is not fixed—it shifts with market changes, requiring ongoing management. Returning to the call option example: initially, you hedged by shorting 50 shares when the delta was 0.5. Now, suppose the delta decreases from 0.5 to 0.3 due to market shifts. This change makes your hedge overly short. To maintain a delta-neutral position, you would buy back 20 shares, adjusting your net short position to 30 shares. This continuous rebalancing helps keep the portfolio aligned with changes in delta.
Tracking changes in delta exposure becomes especially important here. Models like Black-ScholesMerton (BSM) provide Greeks, which help predict how option prices may change. Some second-order Greeks, in particular, allow us to monitor delta’s sensitivity to various factors. For example, Gamma measures how delta responds to changes in the underlying price, Charm tracks delta’s sensitivity to the passage of time, and Vanna reflects delta’s response to shifts in implied volatility (IV).
Tracking changes in delta exposure becomes especially important here. Models like Black-ScholesMerton (BSM) provide Greeks, which help predict how option prices may change. Some second-order Greeks, in particular, allow us to monitor delta’s sensitivity to various factors. For example, Gamma measures how delta responds to changes in the underlying price, Charm tracks delta’s sensitivity to the passage of time, and Vanna reflects delta’s response to shifts in implied volatility (IV).
Delta Hedging
Understanding Greeks
Options Greeks help anticipate potential shifts in an option’s price. Building on our understanding, we now focus on changes in the net delta of a portfolio within the framework of continuous delta hedging. These shifts are explained by second-order Greeks, which measure how delta changes with respect to various factors like the underlying price, time, and implied volatility. Let’s explore this concept in more detail.
In the context of hedging an option, two distinct phases unfold:
1. Initial Hedge: This phase focuses on offsetting the option’s delta by adjusting the position accordingly. Here, an initial underlying position is added to the dealer’s book to counterbalance the option’s impact on the portfolio. This step is relatively straightforward.
2. Continuous Re-Hedging: The second phase involves managing the portfolio’s delta exposure over time as market conditions shift. An option’s delta can vary significantly in response to factors that influence its value. Here, we focus on three primary components that drive these fluctuations: underlying price (Gamma), time (Charm), and implied volatility (Vanna).
This distinction between the initial and continuous re-hedging is key to understanding how delta exposure is managed dynamically.
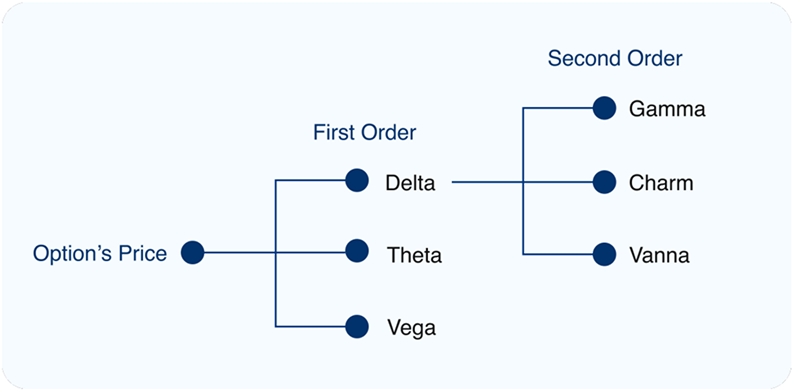
Figure 3. Call Option Delta Hedging
Initial Hedge
Calls, puts, long, and short contracts introduce different immediate directional pressures on market makers. For instance, when a customer buys calls, the market maker who sells them is left with a negative delta exposure, prompting an initial hedge by buying the underlying asset to neutralise this position. Conversely, if a customer sells calls or buys puts, the market maker’s initial hedge would involve selling the underlying to offset a positive delta. This initial hedging action provides insights into options flow, as it reveals both the direction market makers must take to balance new positions and the underlying sentiment of customers.
Customer sentiment heavily influences options flow. When a customer buys calls or sells puts, it often signals a bullish stance, suggesting a speculative bet on an underlying price rise. Conversely, buying puts or selling calls generally reflects bearish expectations, with intentions to profit from a price decline. By the time traders observe this flow, market makers’ hedges are typically already in place, meaning the flow reflects sentiment rather than predicting hedging responses. Significant flow, whether bullish or bearish, offers a snapshot of market sentiment.
Traders interpret directional sentiment by examining how customers place their bets. Rather than focusing on hedging mechanics, heavy call-buying reflects a strong belief in upside potential, while substantial put-buying signals expectations of a decline. This approach highlights the intent behind customer actions, offering a lens to interpret prevailing market sentiment effectively.
Continuous Re-Hedging
In the context of extensive options trading on the SPX, market makers manage vast portfolios with substantial positions. While the initial delta hedge provides a starting point, it’s only part of the equation. As time passes, underlying prices fluctuate, and implied volatility shifts, these changes lead to significant swings in the portfolio’s delta, demanding frequent and substantial adjustments. This is where second-order Greeks become essential, providing deeper insights into these large, continuous delta fluctuations primarily driven by time, spot price, and implied volatility dynamics.
Second Order Greeks of Delta
To delve deeper, let’s first visualize the delta of a call and a put relative to the underlying price at various points, as shown in Figure 4. Several insights emerge:
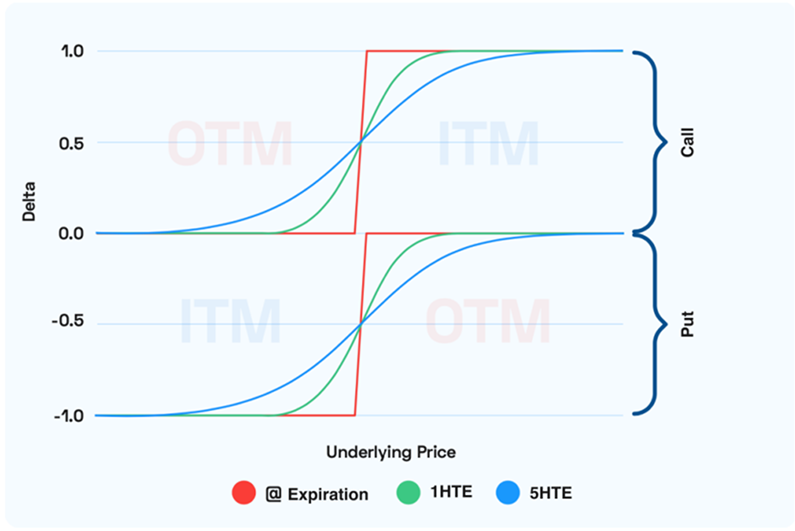
Figure 4. Options Delta vs Underlying Price
Observations
- Call options possess a positive delta between 0 and 1
- Put options carry a negative delta between -1 and 0
- The slope of delta vs. underlying is consistently positive for both call and put options.
- The slope of delta vs. underlying is steeper around the strike price as expiration approaches.
- As time passes, if the underlying price is above the strike price, delta increases for both a call or a put.
- As time passes, if the underlying price is below the strike price, delta decreases for both a call or a put.
Gamma - Delta Change with Underlying Price
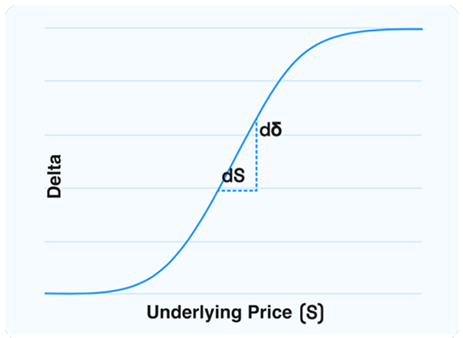
Figure 5. Gamma Derivative of Delta
To understand delta more clearly, let’s explore a simple example. Suppose you purchase a call option on a stock, where each contract represents 100 shares. The call option has a delta of 0.5, meaning that for every dollar increase in the stock price, the option’s value rises by 50 cents per share, leading to a $50 gain (given the 100-share quantity). Conversely, a $1 drop in the stock price would decrease the option’s value by $50.
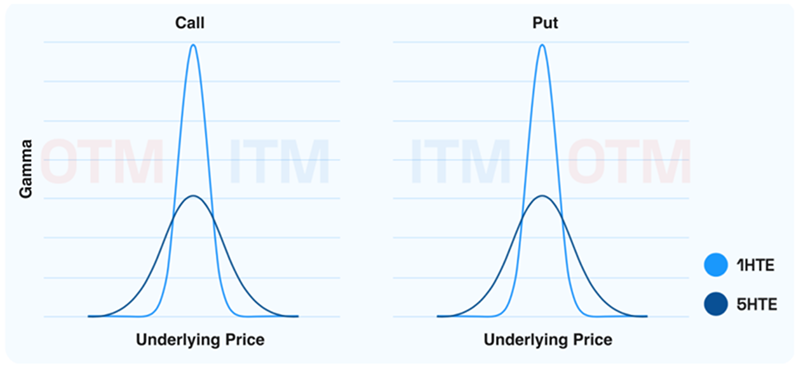
Figure 6. Options Delta vs Underlying Price
The hedging response to these delta shifts remains consistent: as prices rise, delta exposure increases, prompting market makers who are long on options to sell in order to offset the effect. Conversely, as the underlying price falls, delta exposure decreases, leading market makers to buy the underlying asset as a hedge.
When market makers experience a positive gamma exposure, their positioning enables them to provide liquidity, buying or selling against price movements. As highlighted in Figure 6, this effect becomes even more pronounced as expiration approaches.
When market makers experience a positive gamma exposure, their positioning enables them to provide liquidity, buying or selling against price movements. As highlighted in Figure 6, this effect becomes even more pronounced as expiration approaches.
Short Option Position
Shifting our focus from contract types, market makers with a short option position find themselves “short gamma”. In fact, when the dealer holds a negative position for a specific contract, it results in a vertical reflection of figures 4 and 6. This leads delta to have a negative slope with respect to the underlying price. See figures 7 and 8 for a visual illustration.
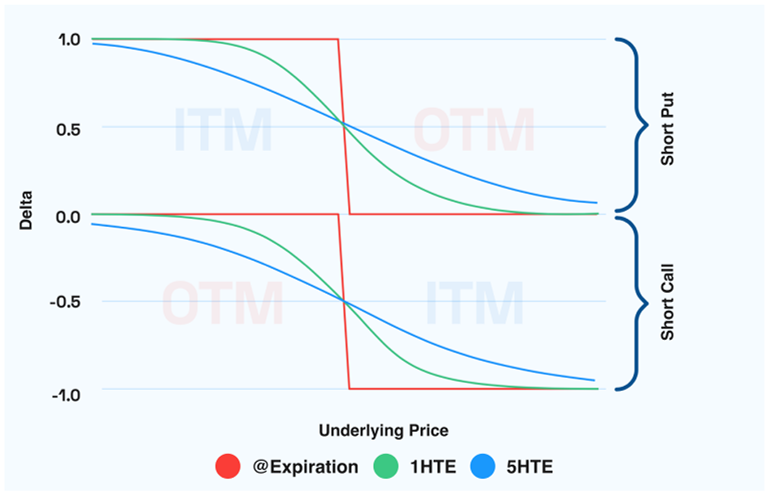
Figure 7. Options Delta vs Underlying Price
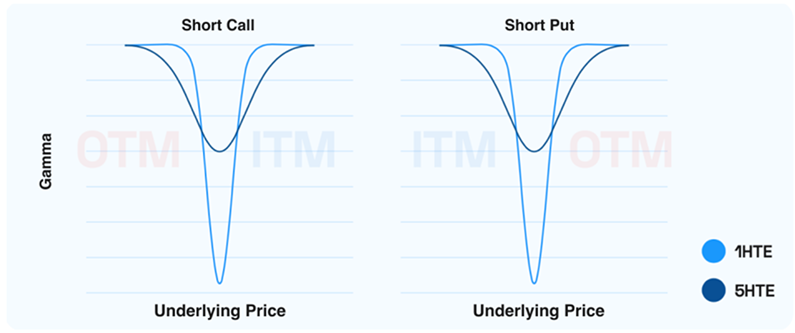
Figure 8. Options Delta vs Underlying Price
In this context, the hedging process differs from the one discussed earlier. As the spot price rises, the portfolio’s delta decreases, prompting the market maker to purchase in line with the market trend. Conversely, as the spot price falls, the delta exposure increases, leading the market maker to sell, thereby balancing the portfolio with the declining underlying price.
Negative gamma compels market makers to compete, and take liquidity out of the market. Such an environment may cause the underlying price to move more erratically.
Negative gamma compels market makers to compete, and take liquidity out of the market. Such an environment may cause the underlying price to move more erratically.
Charm - Delta Change with Time
As time progresses, the influence of Charm, a Greek measuring the effect of time on an option’s delta, becomes increasingly significant. Within delta hedging, Charm often produces predictable outcomes. Its behavior hinges on two key factors: the net position of the option (long or short) and the relationship between the underlying price and the strike. For long options, as shown in Figure 4, Charm is positive when the underlying price exceeds the strike and negative when it falls below. Figure 9 provides a detailed visualization of these dynamics
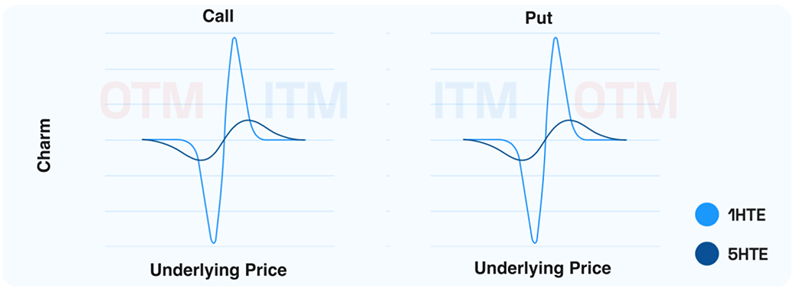
Figure 9. Options Delta vs Underlying Price
Figure 9 highlights important observations about Charm’s effects over time. When Charm is negative, an option’s delta decreases as time passes, requiring market makers with a net negative Charm to buy the underlying asset to adjust their delta exposure. Conversely, positive Charm results in delta increasing over time, prompting market makers to sell the underlying to maintain their hedge. Much like Gamma, the impact of Charm becomes more pronounced as expiration nears, intensifying the hedging adjustments required.
The net positioning of options, similar to Gamma dynamics, is pivotal. Rather than focusing on whether the option is a call or a put, the critical factor is the net position—long or short. A net short position effectively mirrors the effects seen with Gamma, inverting the chart vertically. Figure 10 illustrates this, showing that the graphical patterns of Charm remain consistent, regardless of whether calls or puts are involved, emphasizing the importance of positioning in hedging strategies.
The net positioning of options, similar to Gamma dynamics, is pivotal. Rather than focusing on whether the option is a call or a put, the critical factor is the net position—long or short. A net short position effectively mirrors the effects seen with Gamma, inverting the chart vertically. Figure 10 illustrates this, showing that the graphical patterns of Charm remain consistent, regardless of whether calls or puts are involved, emphasizing the importance of positioning in hedging strategies.
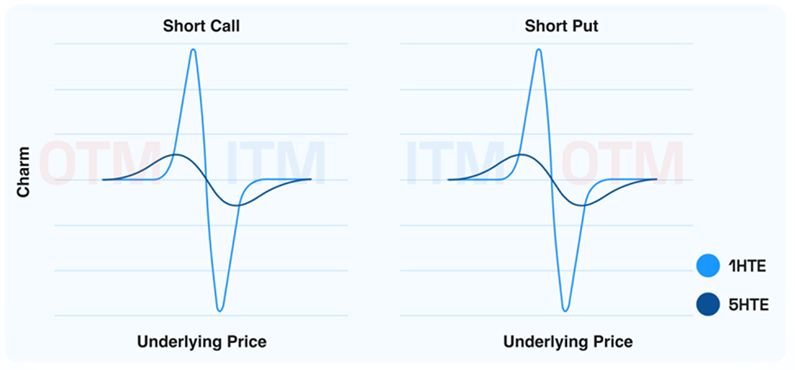
Figure 10. Options Delta vs Underlying Price
Vanna - How Delta Changes With Implied Volatility
Vanna depicts the change in delta of an option contract as its implied volatility shifts. Each individual option contract possesses its own unique IV value. Unlike Gamma and Charm, which measure delta’s response to changes in underlying price and time respectively, IV introduces a layer of complexity. These two parameters—price and time—are common to all option contracts, making it relatively straightforward to evaluate Gamma and Charm across a large options portfolio.
However, understanding Vanna is not as visually intuitive. Traditional trading often relies on Cartesian candlestick charts, where the x-axis represents time and the y-axis represents the underlying price. This makes the impact of Gamma and Charm relatively easy to grasp, as their effects can be visualized along these familiar axes. In contrast, IV operates somewhat independently of these dimensions. To fully grasp Vanna, one must consider how the fixed strike IVs of options have changed, particularly within the context of a market maker’s portfolio. This effect cannot be seen on a candlestick chart.
However, understanding Vanna is not as visually intuitive. Traditional trading often relies on Cartesian candlestick charts, where the x-axis represents time and the y-axis represents the underlying price. This makes the impact of Gamma and Charm relatively easy to grasp, as their effects can be visualized along these familiar axes. In contrast, IV operates somewhat independently of these dimensions. To fully grasp Vanna, one must consider how the fixed strike IVs of options have changed, particularly within the context of a market maker’s portfolio. This effect cannot be seen on a candlestick chart.
Despite the complexities, Vanna’s impact on delta hedging dynamics is significant and warrants close attention.
The figures 11 and 12 display Vanna exposure for a single contract across different underlying prices and expirations.
The figures 11 and 12 display Vanna exposure for a single contract across different underlying prices and expirations.
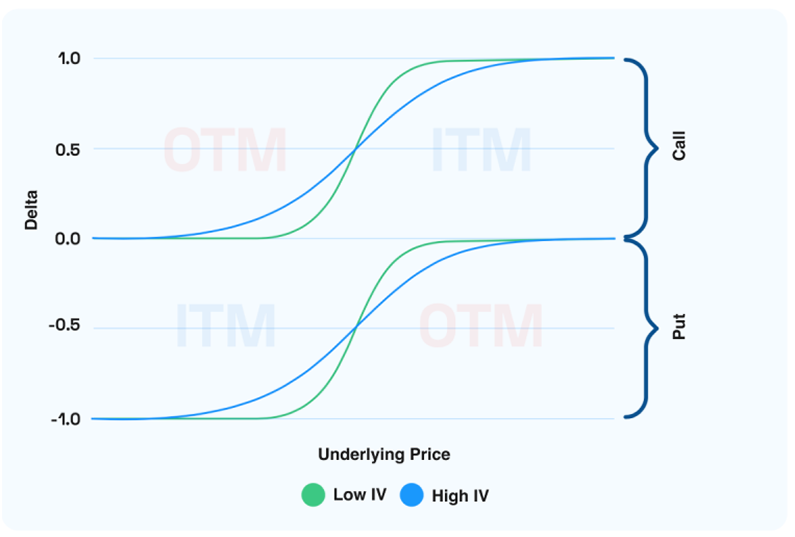
Figure 11. Options Delta vs Underlying Price
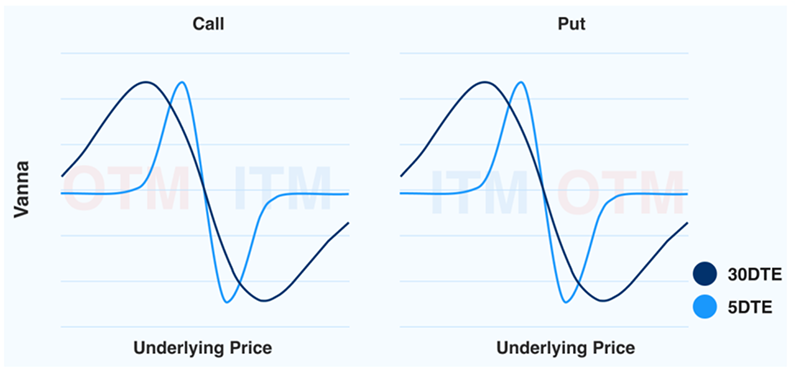
Figure 12. Options Delta vs Underlying Price
Chart Observations:
Expiration Impact:
Underlying Price Vanna also exerts a strong influence on further-dated contracts.
Moneyness Influence:
Contracts that are slightly in-the-money or out-of-the money have a significant impact on Vanna.
Positive Vanna
- Calls (OTM): With a rise in IV, delta increases from positive to more positive
- Puts (ITM): With a rise in IV, delta increases from negative to less negative.
Negative Vann
- Calls (ITM): With a rise in IV, delta decreases.
- Puts (OTM): With a rise in IV, delta becomes more negative
Case
Below Strike

Vanna > 0
OTM Call, ITM Put
Below Strike
Vanna < 0
ITM Call, OTM Put
IV
Delta
Delta
IV
Delta
Delta
Unlike Gamma and Charm, where the most significant impacts are seen near the strike price and close to expiration, Vanna can influence almost all contracts on the options chain. This underscores the considerable role Vanna plays in delta hedging for market makers.
Positive Vanna Scenario
IV Increases: When Vanna is positive and IV increases, the delta of the option increases. To rebalance their portfolio, market makers need to sell the underlying asset.
IV Decreases: Conversely, if IV decreases, the delta of the option decreases. In this case, market makers would need to buy the underlying asset to maintain a neutral position.
IV Decreases: Conversely, if IV decreases, the delta of the option decreases. In this case, market makers would need to buy the underlying asset to maintain a neutral position.
Negative Vanna Scenario
IV Increases: With a negative Vanna, an increase in IV causes the delta of the option to decrease. This prompts market makers to buy the underlying asset to rebalance.
IV Decreases: When IV decreases, the delta increases, leading market makers to sell the underlying asset to stay hedged.
IV Decreases: When IV decreases, the delta increases, leading market makers to sell the underlying asset to stay hedged.
Final Thoughts
Delta hedging unfolds in two distinct stages: an initial countermove and ongoing adjustments in response to the evolving delta within an options portfolio. Market makers, managing vast portfolios of options, are in constant motion, continuously recalibrating their positions. This perpetual rebalancing intensifies as time ticks closer to an option’s expiration, amplifying the frequency and magnitude of hedging activities. In today’s market, the expansion of options trading, particularly with the introduction of daily expirations on SPX, highlights how the cumulative effect of delta hedging has become a critical force driving market behavior.
The SPX alone offers approximately 20,000 tradeable option contracts, each with substantial trading volumes. The sheer scale of this market, combined with the explosive rise of 0DTE options and the increasing prevalence of shorter-term expirations, has created a unique environment where the influence of market makers’ hedging on the underlying price has never been more pronounced. As these contracts near their expiration, the need for constant re-hedging compounds, creating a significant cumulative impact that can drive sharp intraday price moves and influence broader market trends.
This dynamic represents a perfect storm for understanding how delta hedging impacts price behavior. By digging deeper into the unseen forces shaping the market like market makers’ positions, gamma exposures, and their delta hedging flows we gain invaluable insight into the mechanics behind these movements. Assessing these factors across a market maker’s entire portfolio provides traders with a decisive edge.
At OptionsDepth, we specialize in uncovering these hidden layers of the market. With advanced tools and data-driven insights, we empower our users to navigate the complexities of options-driven market activity with precision and confidence. In a market increasingly shaped by the rise of 0DTE options and the immense scale of SPX options trading, understanding these forces is not just an advantage it’s essential.

.svg)
.png)
.png)

.svg)
